Global Markets & Investment Views – Jan 29 2024
- Jan 29, 2024
- 2 min read
Updated: Jan 5

High-Quality Fixed Income – Overweight duration
The Federal Reserve is expected to hold rates flats at their meeting this week. Rates currently have a 98% likelihood of staying flat at the January 31st FOMC meeting and a nearly 100% chance

of being down by the June 12th FOMC meeting according to the CME's FedWatch tool. This signals a high likelihood that short-term rates will be flat to down over the next six months. As such, longer-duration assets are becoming more attractive. The Fed announced they will likely cut rates three times this year at 0.25% each.
High Yield Fixed Income – Overweight credit

The main drivers of returns in this asset class are defaults and interest rate spreads. Default rates have risen to 2.88% in December, but are still below the long-run average of 3.54%. They are not expected to rise much beyond the long-run average since most companies refinanced their debt to long-term low rates and do not have debt maturities in the next year. That said, spreads are tight at 3.58%. Also, delinquency rates, which are seen as a leading indicator of defaults, have risen over the past several quarters and remain low at 1.32%. We remain

slightly overweight given the mix of low default risk, higher yield, and low delinquency rates. We will return to underweight if we see a rise in delinquency rates. We will increase our overweight if spreads widen beyond their long-run average.
US Equities – Underweight, tilt toward value

Up over the last month with broad participation except for healthcare and energy. The forward P/E ratio for US equities is 19.5x as of December 31st and has risen sharply in the past month. The 20-year average P/E ratio for the S&P500 is 15.6x which means that US Equities continue to be increasingly expensive relative to history.* Small cap value stocks, however, have a P/E ratio of 16.3x compared to a 20-year average of 16.7x.
International Developed Equities – Overweight, tilt toward Japan

P/E ratio for the MSCI ACWI ex-US index is 12.9x as of December 31st compared to its 20-year average of 13.1x. This represents a 33.7% discount to the S&P 500 after one corrects for the natural discount of the MSCI ACWI Ex-US to the S&P500.* Japan appears to be poised to outperform in the years ahead as their P/E is historically low and the government is enacting policies that are likely to raise the profitability of companies. The US dollar continues to fall and provides a positive tailwind for non-dollar assets (and US travelers abroad).
Emerging Markets (EM) – Neutral, underweight China, overweight Korea, Mexico, India
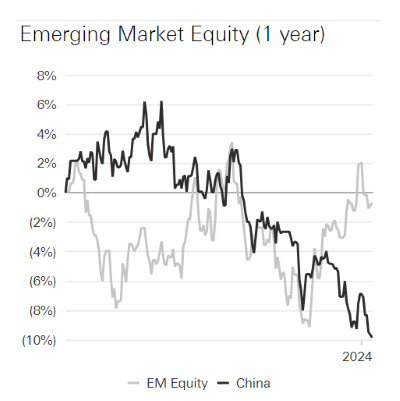
Neutral Weight with regional preferences. There is generally more risk in this asset class than in International Developed and US Equity. The reasons for this are manifold and include a lesser presence of the rule of law, a higher level of corruption, and increased regional instability. The MSCI Emerging Markets Index Price-to-earnings multiple (11.9x) is roughly in line with the long-run average (11.3x). One area of concern in this area is China, which comprises 25% of the index. We are underweight in China but maintain a neutral weight to EM exposure by being overweight in Korea, Mexico, and India.
Notes: *https://am.jpmorgan.com/us/en/asset-management/adv/insights/market-insights/guide-to-the-markets/ page 35. 2) Ibid, pg. 45. 3) Ibid pg. 46.
